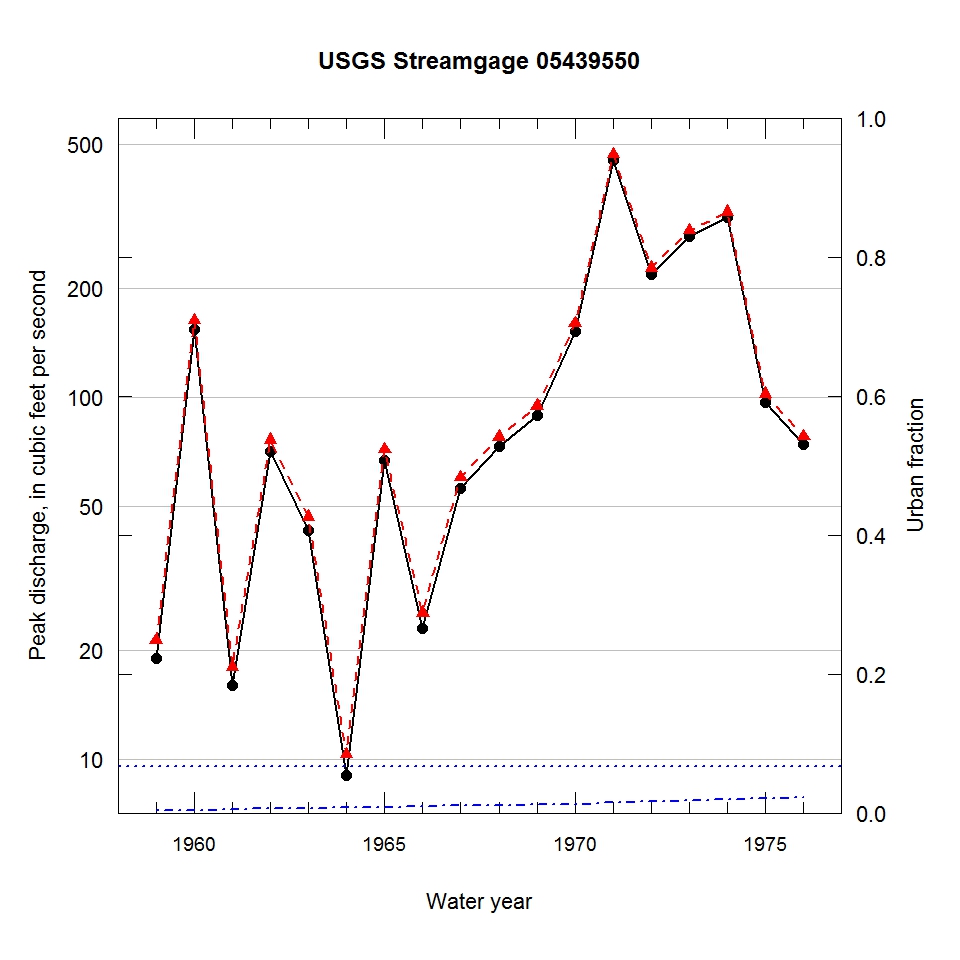
Observed and urbanization-adjusted annual maximum peak discharge and associated urban fraction and precipitation values at USGS streamgage:
05439550 SOUTH BRANCH KISHWAUKEE RIVER TRIB NR IRENE, IL


| Water year | Segment | Discharge code | Cumulative reservoir storage (acre-feet) | Urban fraction | Precipitation (inches) | Observed peak discharge (ft3/s) | Adjusted peak discharge (ft3/s) | Exceedance probability |
| 1959 | 1 | -- | 0 | 0.004 | 0.990 | 19 | 21 | 0.956 |
| 1960 | 1 | -- | 0 | 0.004 | 0.517 | 154 | 163 | 0.106 |
| 1961 | 1 | -- | 0 | 0.005 | 0.970 | 16 | 18 | 0.968 |
| 1962 | 1 | -- | 0 | 0.006 | 1.309 | 71 | 76 | 0.557 |
| 1963 | 1 | -- | 0 | 0.007 | 1.538 | 43 | 47 | 0.811 |
| 1964 | 1 | -- | 0 | 0.008 | 0.827 | 9 | 10 | 1.000 |
| 1965 | 1 | -- | 0 | 0.009 | 0.865 | 67 | 72 | 0.602 |
| 1966 | 1 | -- | 0 | 0.010 | 1.201 | 23 | 25 | 0.941 |
| 1967 | 1 | -- | 0 | 0.010 | 1.236 | 56 | 60 | 0.701 |
| 1968 | 1 | -- | 0 | 0.011 | 1.261 | 73 | 78 | 0.540 |
| 1969 | 1 | -- | 0 | 0.012 | 1.504 | 89 | 94 | 0.399 |
| 1970 | 1 | -- | 0 | 0.013 | 1.546 | 152 | 160 | 0.115 |
| 1971 | 1 | -- | 0 | 0.015 | 0.340 | 452 | 469 | 0.005 |
| 1972 | 1 | -- | 0 | 0.016 | 1.176 | 219 | 228 | 0.040 |
| 1973 | 1 | -- | 0 | 0.018 | 1.922 | 278 | 289 | 0.019 |
| 1974 | 1 | -- | 0 | 0.019 | 1.167 | 314 | 325 | 0.015 |
| 1975 | 1 | -- | 0 | 0.021 | 0.893 | 97 | 102 | 0.351 |
| 1976 | 1 | -- | 0 | 0.022 | 1.281 | 74 | 78 | 0.539 |

